These two tweets highlight yesterdays volatility spike of 17.8%. This has certainly become a difficult market to read. As we've mentioned it's truly playing tug of war between strong Q2 earnings and economic data while simultaneously concerned about Q3 and Q4 slowing in rate of change terms.
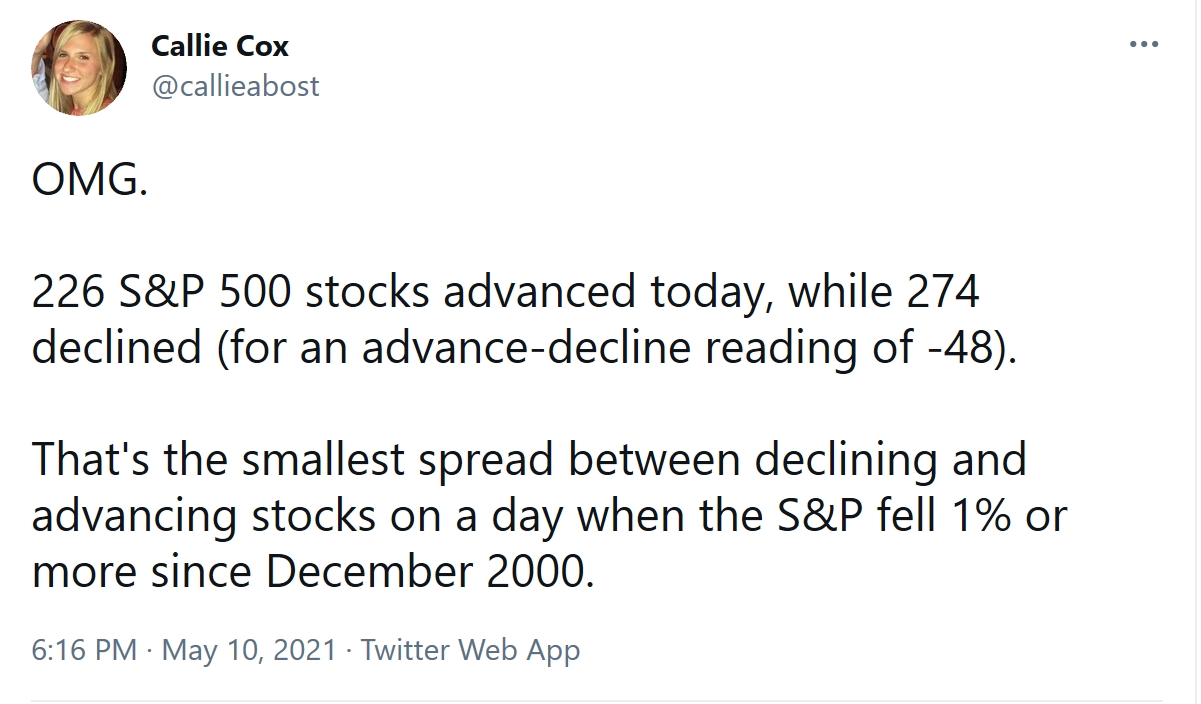
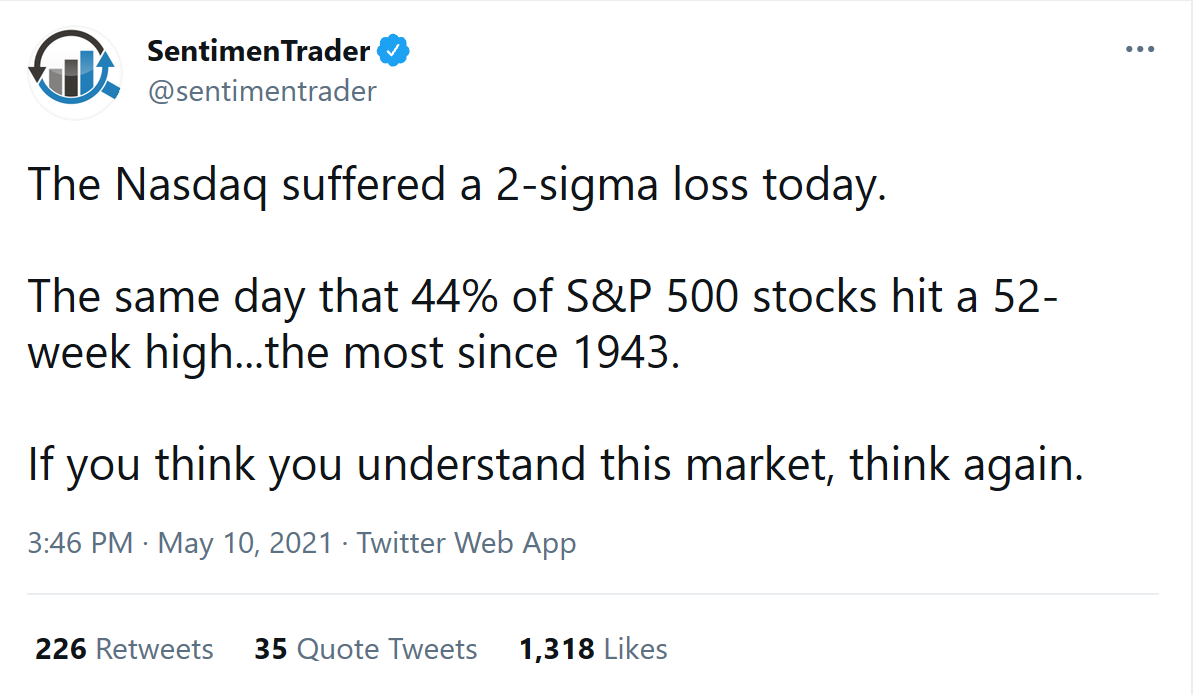
I just have two notes from yesterday's action
- Economic indicators to watch
- IWF joins QQQ, MTUM in bearish trend.
To help digest these conditions further I want to highlight some economic indicators I am following to help gauge whether the market is bullish or bearish. The first economic data that you want to pay attention to is work started for dwellings. New home construction is still accelerating off the pandemic lows but as you can see is losing some steam.
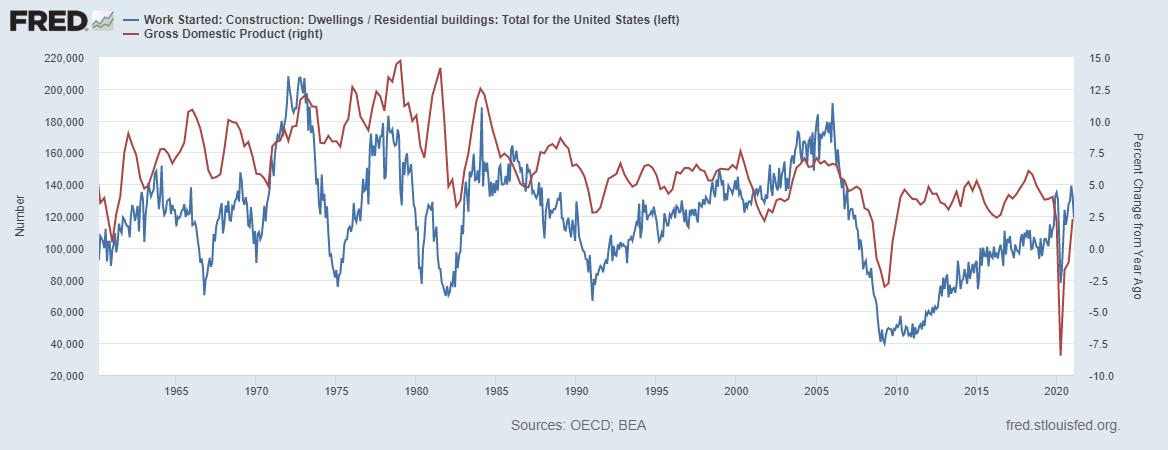
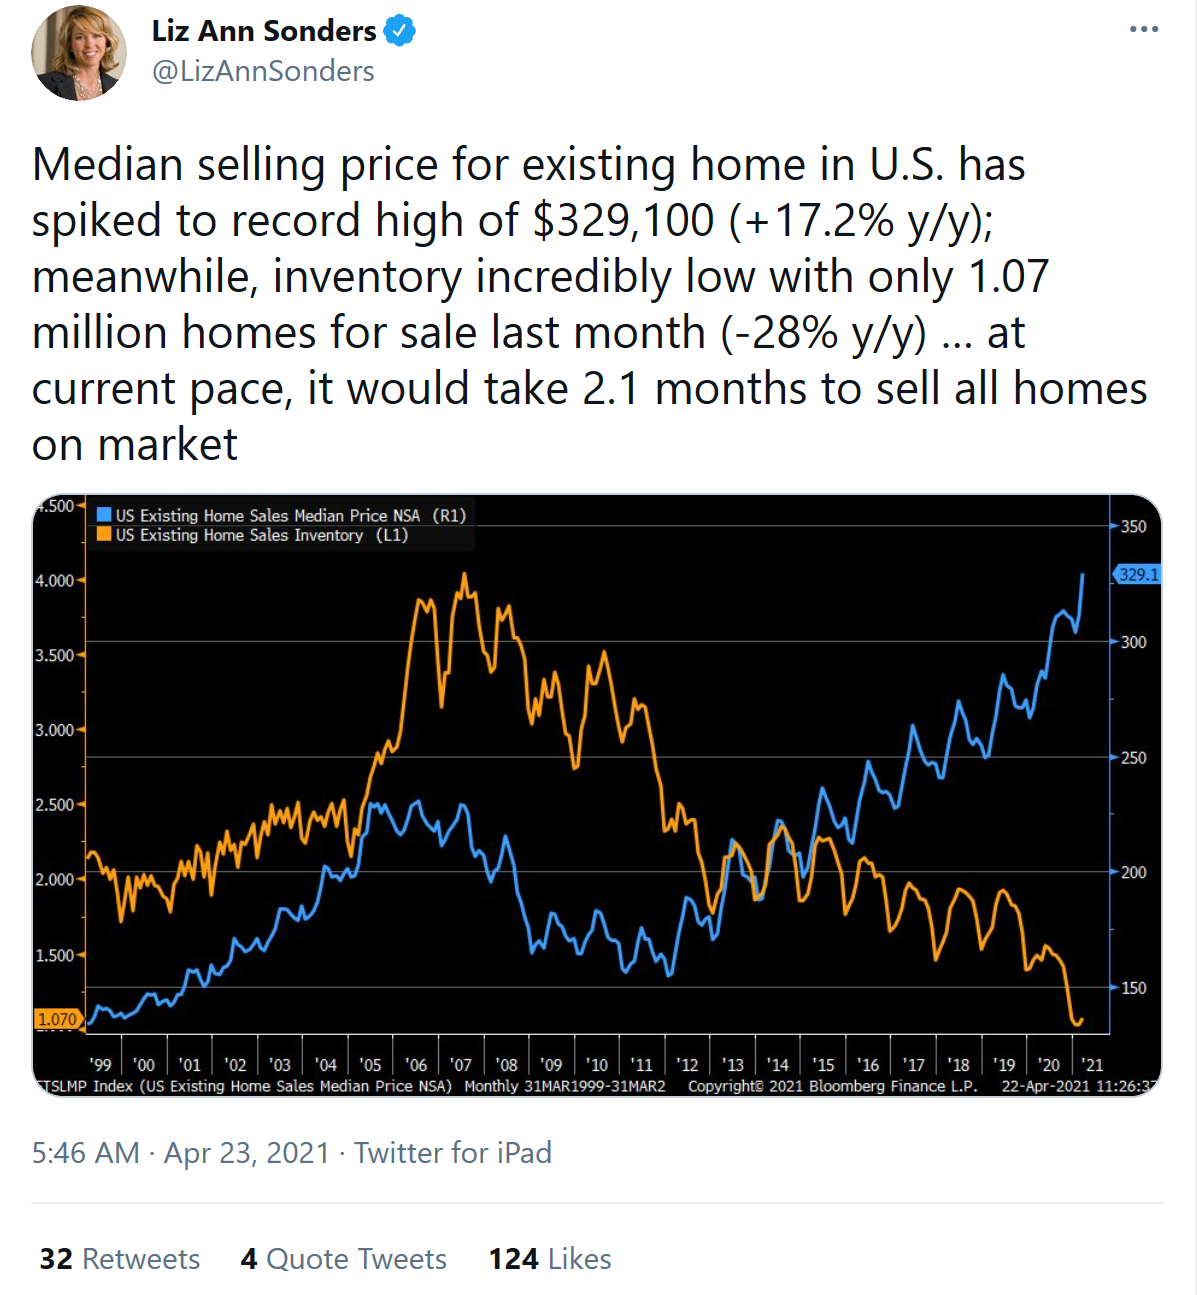
We all know that the housing market has gone crazy because 1. interest rates have dropped, 2. millennials reach prime home buying age, and 3. low inventories. Liz Ann Sonders highlights this boom in her tweet below.
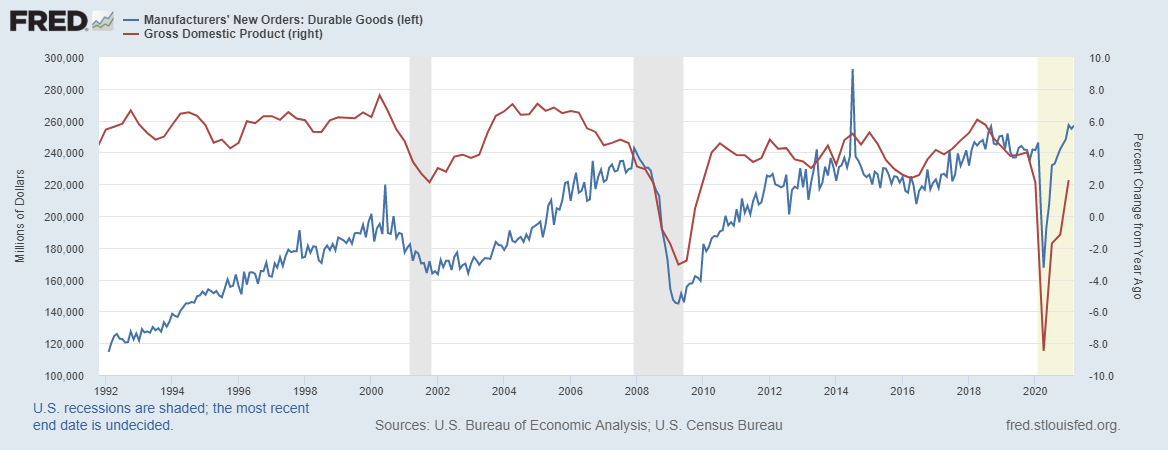
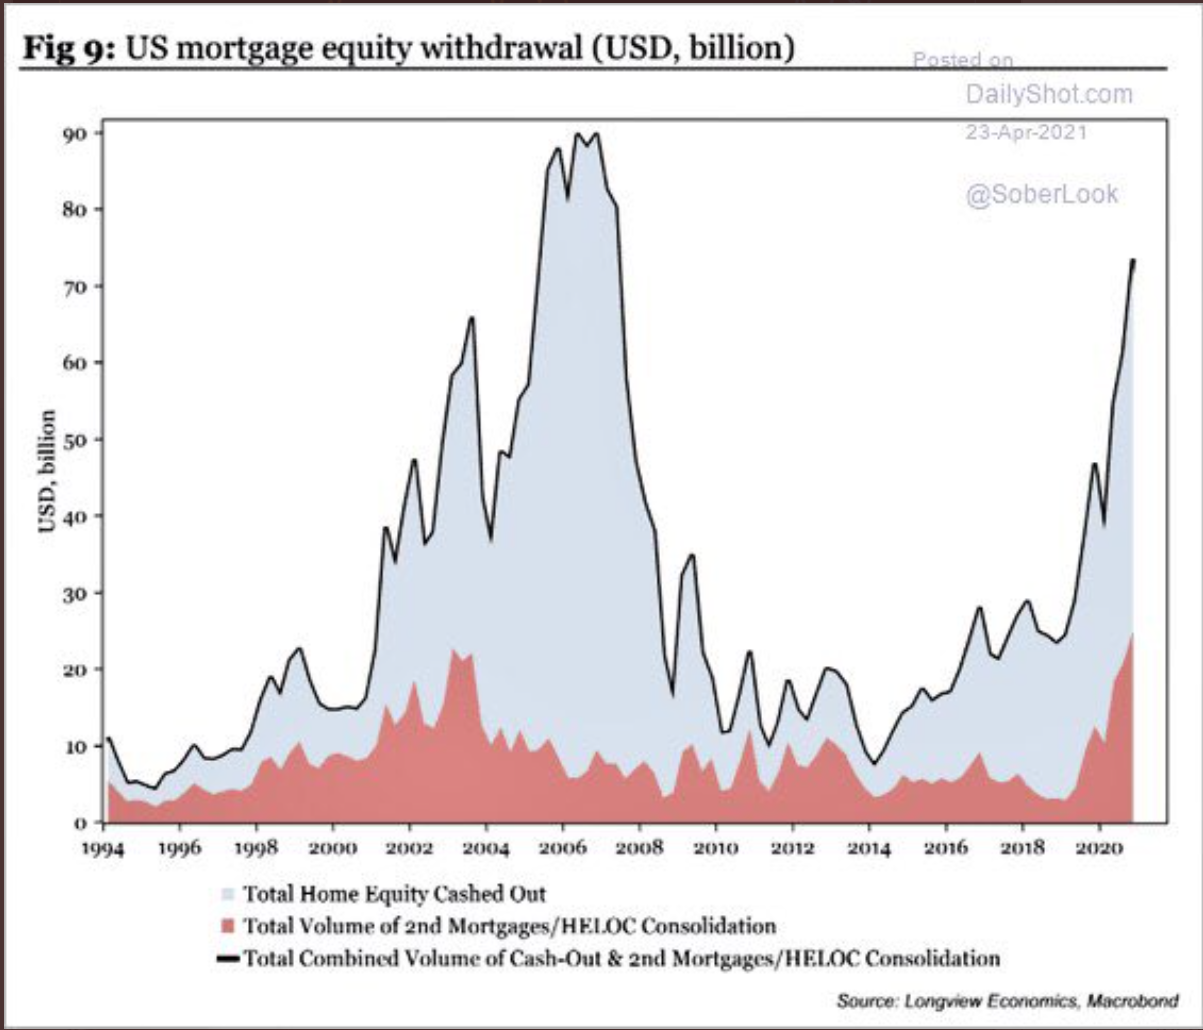
The second indicator I'm watching are durable goods orders. Highlighted in our Q2 Outlook podcast, durable goods have not only recovered, but have soared to 2018 levels. This could be attributed to three rounds of stimulus and fresh HELOCs.
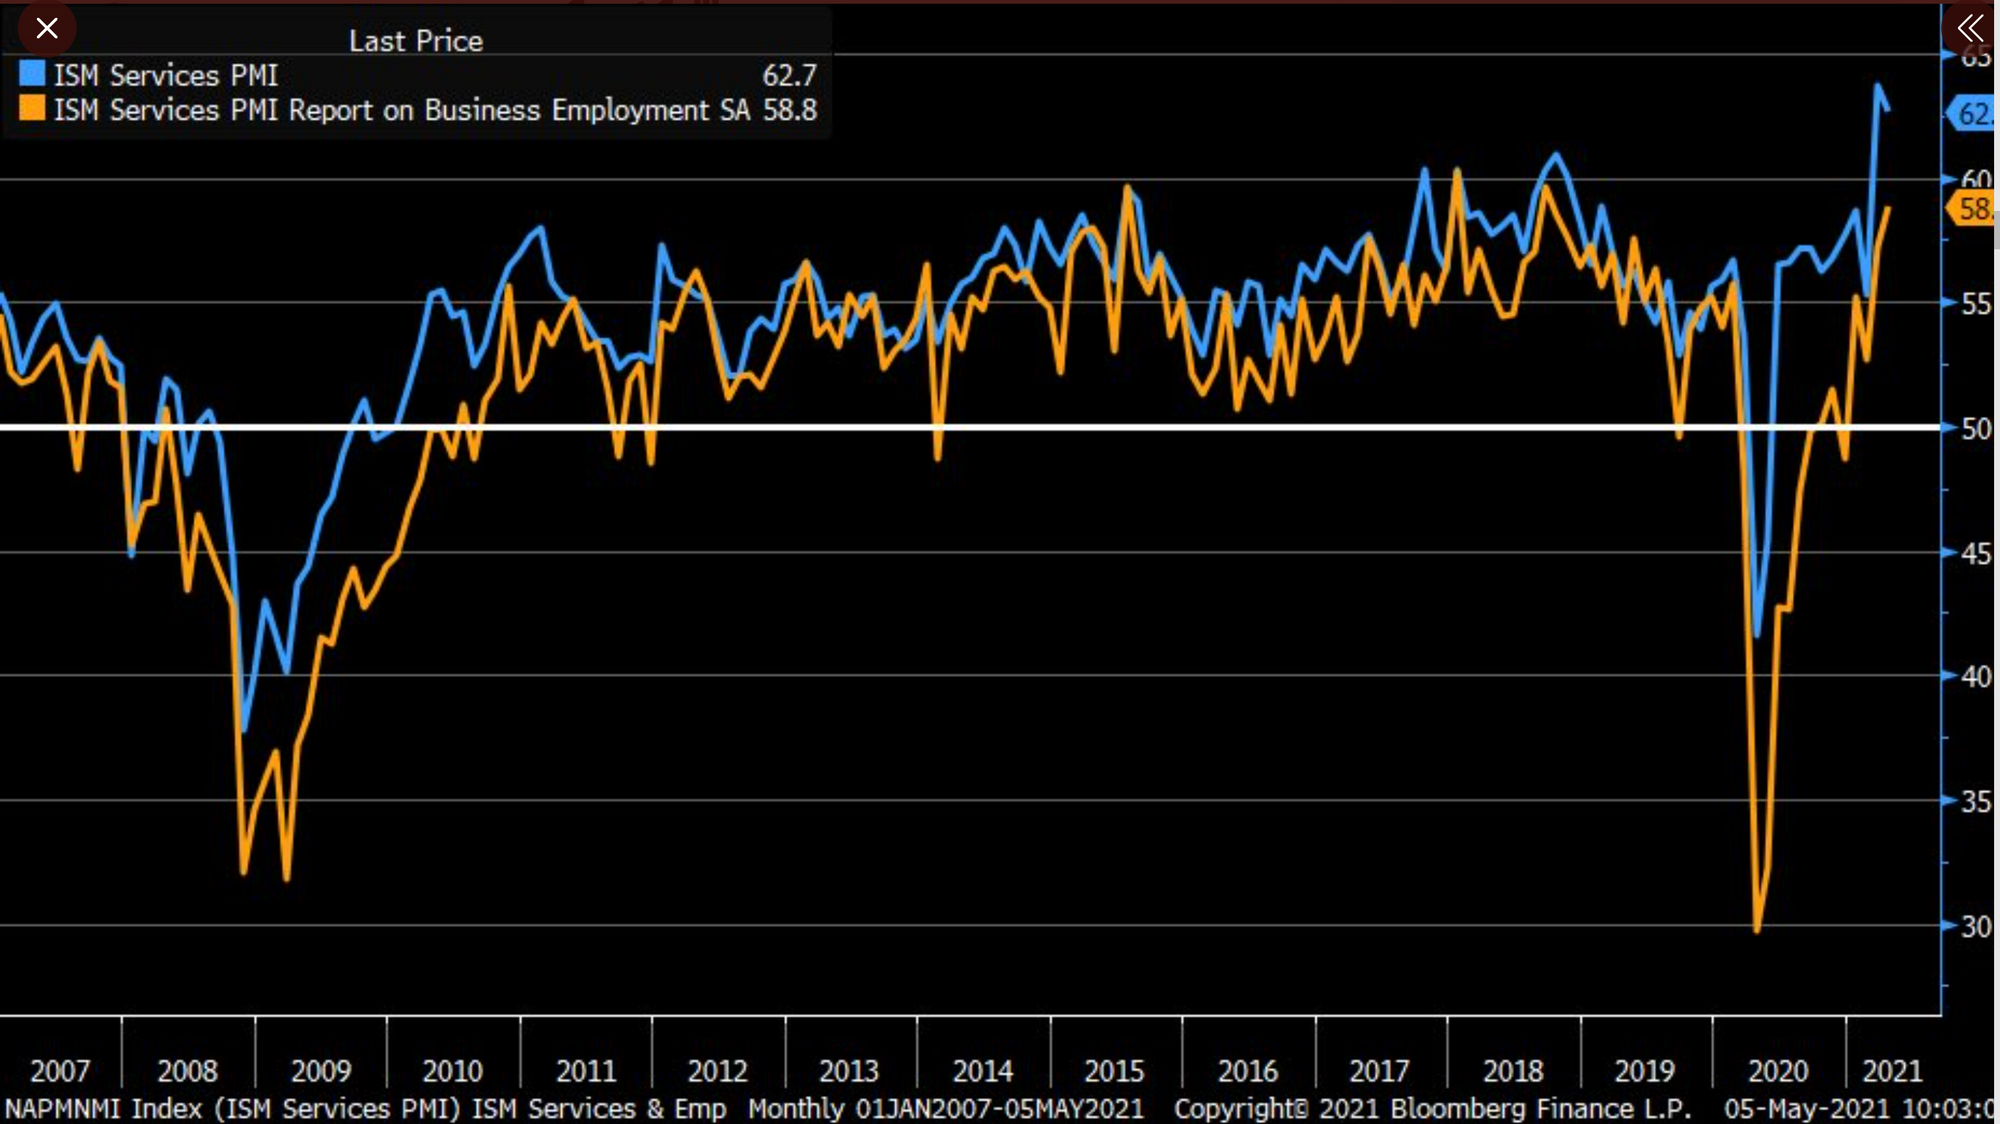
Each are still accelerating but the miss in ISM Services in April (62.7 vs. 64.1 est/63.7 prior month) could indicate the consumer is slowing down.
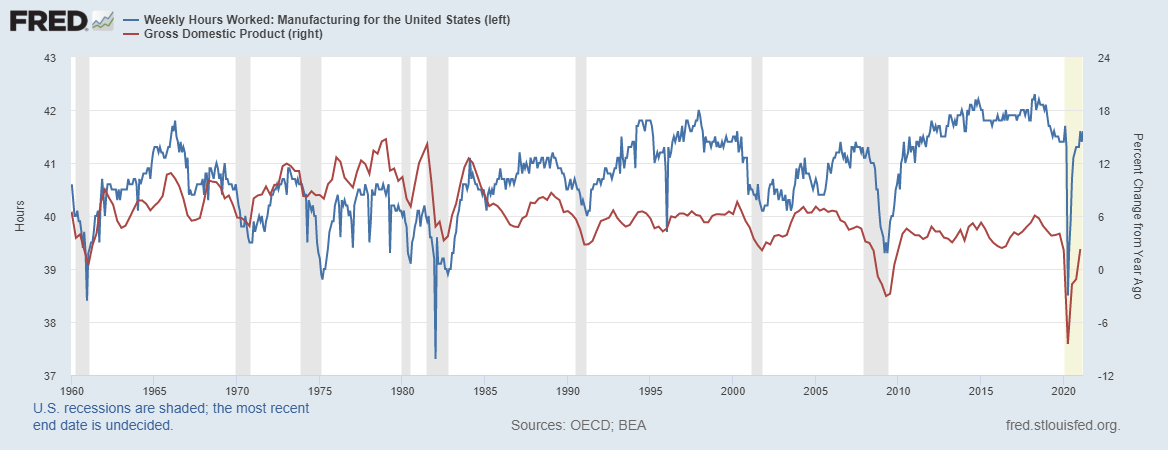
This slow down in consumer spending can also be highlighted in hours worked which are still below pre pandemic levels.
Each of these indicators show signs of a recovery, but one that needs additional support. This could come in the form of additional fiscal spending or continued Fed asset purchases. Either way the market and the economy isn't quite ready to stand on it's own.
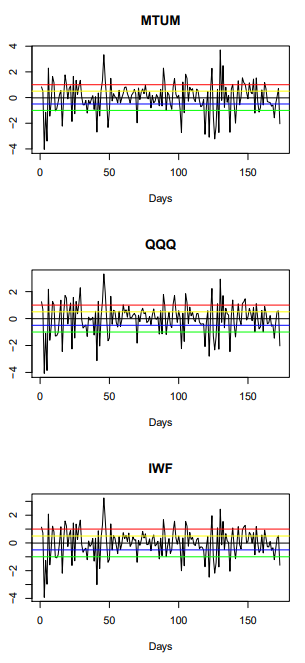
In Monday's trading QQQ, IWF, and MTUM continued its bearish trend selling off -2.53%, -1.99%, and -2.54%. This now puts all three in bearish trend. In our rescaled range all three are trading below 1 sigma in the past 250 days.
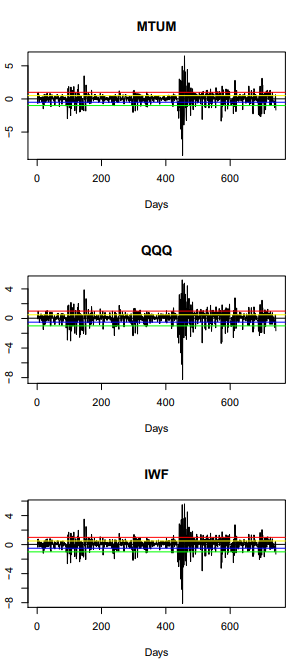
I also included the 3 year rescaled ranges as well because it highlights the increased price volatility of March and April of last year. It also shows how volatility tends to cluster. Essentially, volatility brings on more volatility. We currently are not at March and April levels but I would say MTUM, IWF, and QQQ trending bearish is a clear caution signal to pay attention to. Final point, when rescaling price movements the mean or average is centered around zero. MTUM, IWF, and QQQ had average sigma movement of 0.0144 from May 2018 to Feb 2020. The average sigma movement from April 2020 to today is 0.05 showing that volatility has increased 3.5 times post pandemic shock.
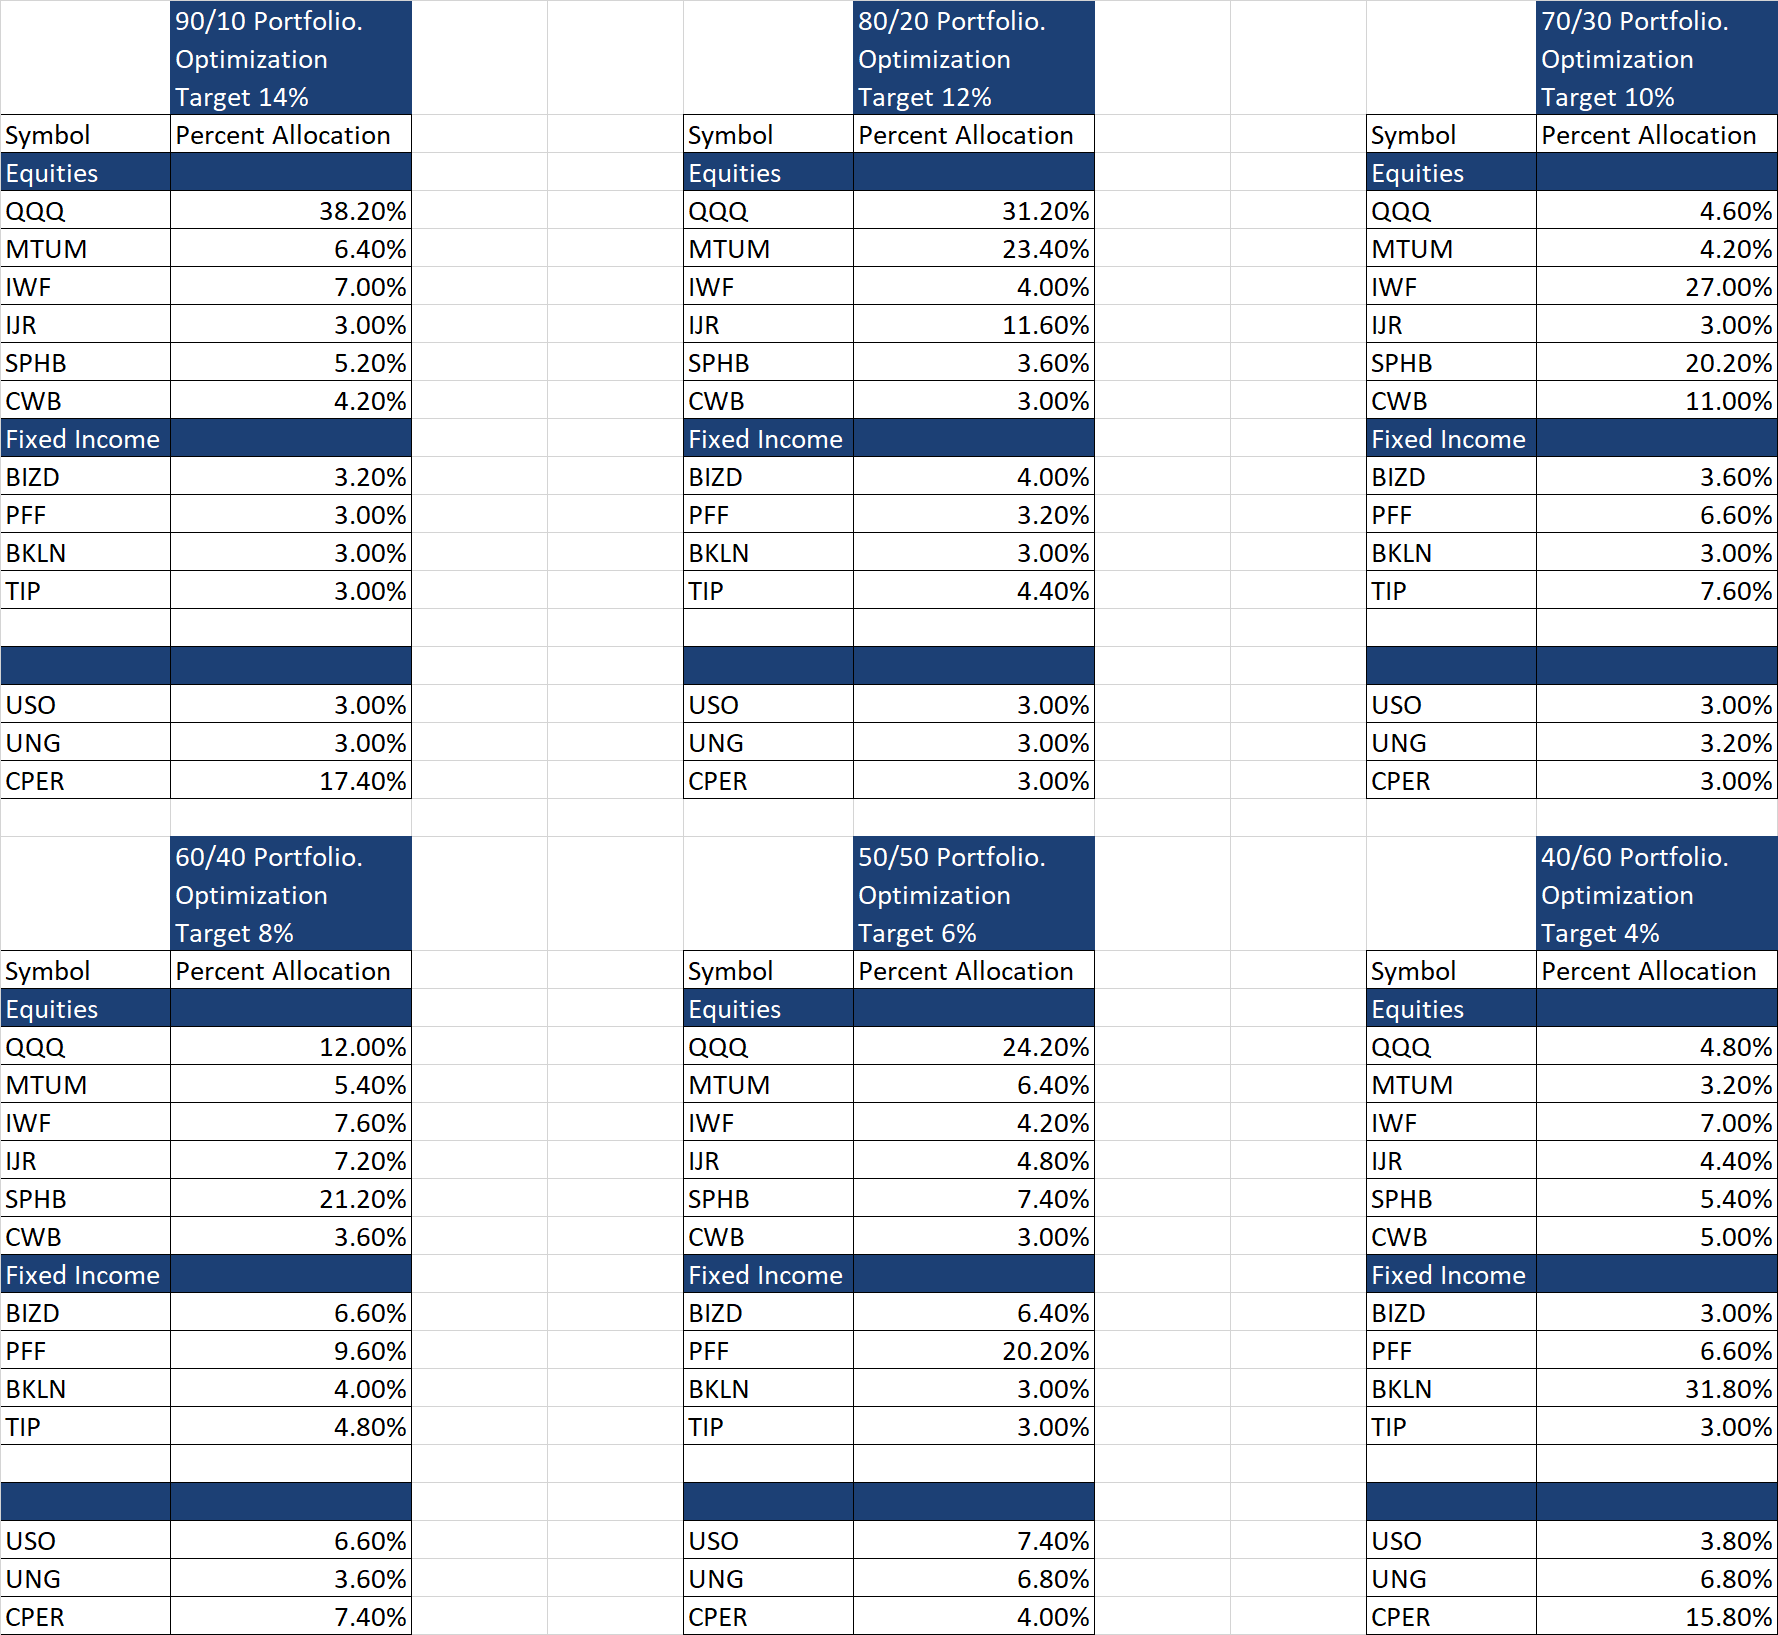
Daily Portfolio Optimization